Intraday dynamics of cultures containing mixture of Cit+ and Cit- clones
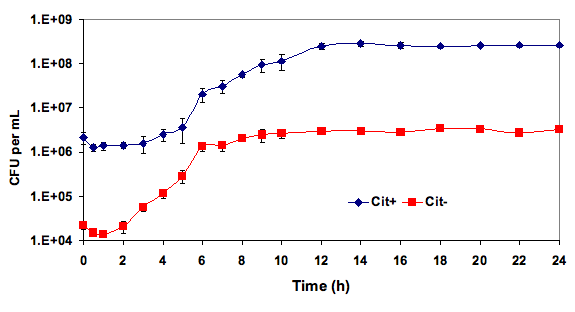
Figure: Intraday dynamics of cultures containing mixture of Cit+ and Cit- clones from generation 33,000. Three Cit+ and three Cit- clones (the latter bearing the Ara+ marker mutation) were grown separately in DM25, then mixed and co-cultured for 5 days in DM25. After diluting the mixture 1:100 into fresh DM25, the population densities of both types were monitored by spreading serial dilutions onto TA agar. Each point is the mean of five replicate cultures. Error bars show standard deviations; when not visible, these bars are as small as or smaller than the symbols plotted. Notice that the Cit- type grew much faster than the Cit+ type over the first 5 h, whereas the Cit+ type grew much faster than the Cit- type between 6 and 12 h.